A record without a map is half a record
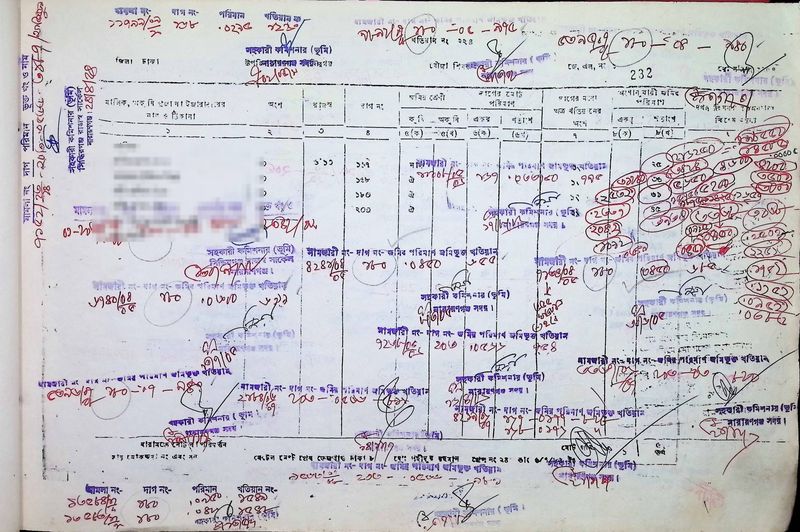
A land record tells you that a person owns plot 448. It does not tell you where plot 448 is, what shape it has or what lies next to it. That is the job of the cadastral map. In most countries the two were made together, by the same survey, and they only make sense together. If you have the record but not the map, you cannot find the land. If you have the map but not the record, you cannot tell who owns it.
Many countries have spent decades and large budgets turning their cadastral maps into digital layers. The usual method is to trace every line by hand on a screen. It works, but it is slow, and it needs trained people who are always in short supply.
Mouza maps in Bangladesh
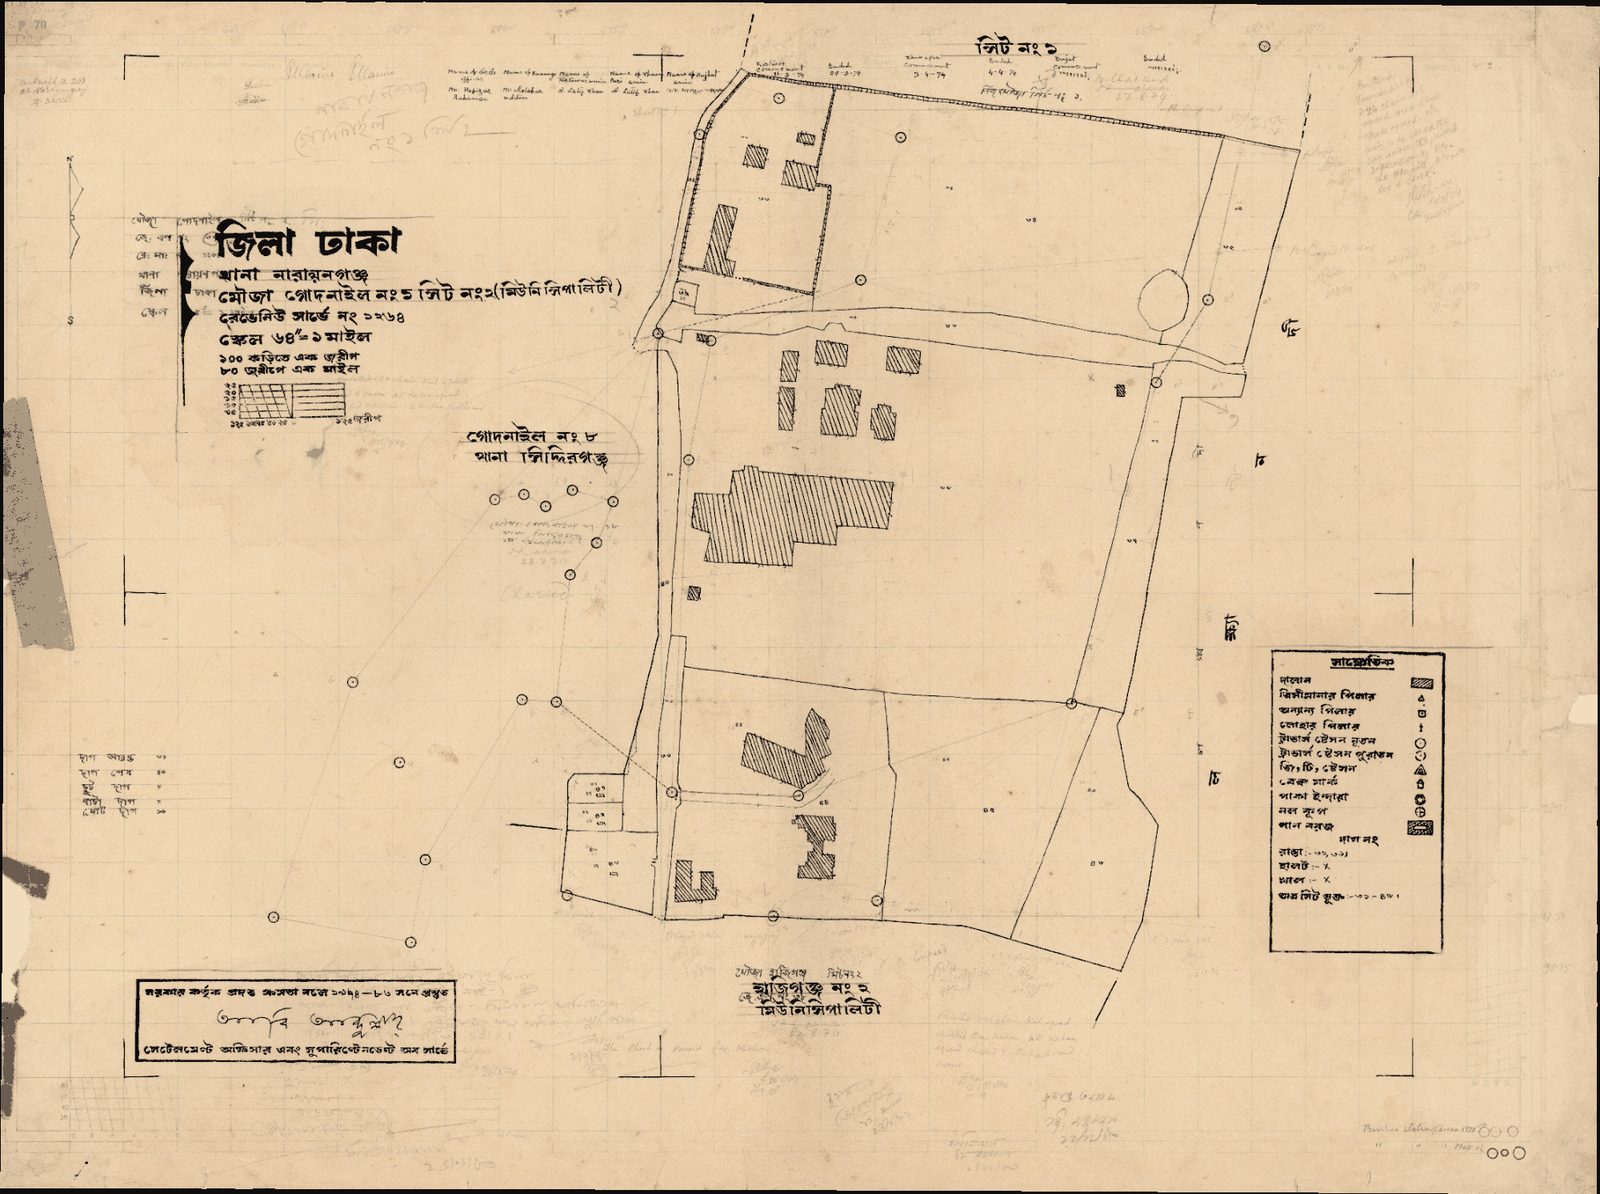
In Bangladesh, every mouza has its own set of maps, drawn by the survey that produced its khatians. Rural sheets are usually drawn at 16 inches to the mile and town sheets at 64 inches to the mile. Each sheet is a large paper drawing with thin ink lines for plot boundaries, a handwritten Bengali number inside every plot, and symbols for houses, ponds, roads and wells. Most of the sheets in use today were drawn decades ago, many in the 1960s, and have been folded, stored and copied many times since.
The government has started a new digital survey. Its first phase covers 634 mouzas across parts of Chattogram, Narayanganj, Rajshahi, Dhamrai, Kushtia and Manikganj (Bangladesh Post). That is real progress. However, Bangladesh has tens of thousands of mouzas, and a fresh survey of every one of them will take many years. In the meantime, the paper maps are what land offices, courts and buyers actually use. Even after a new survey, people will still need the old maps, because a dispute over land bought in 1985 is a dispute about the 1985 map.
What our model does
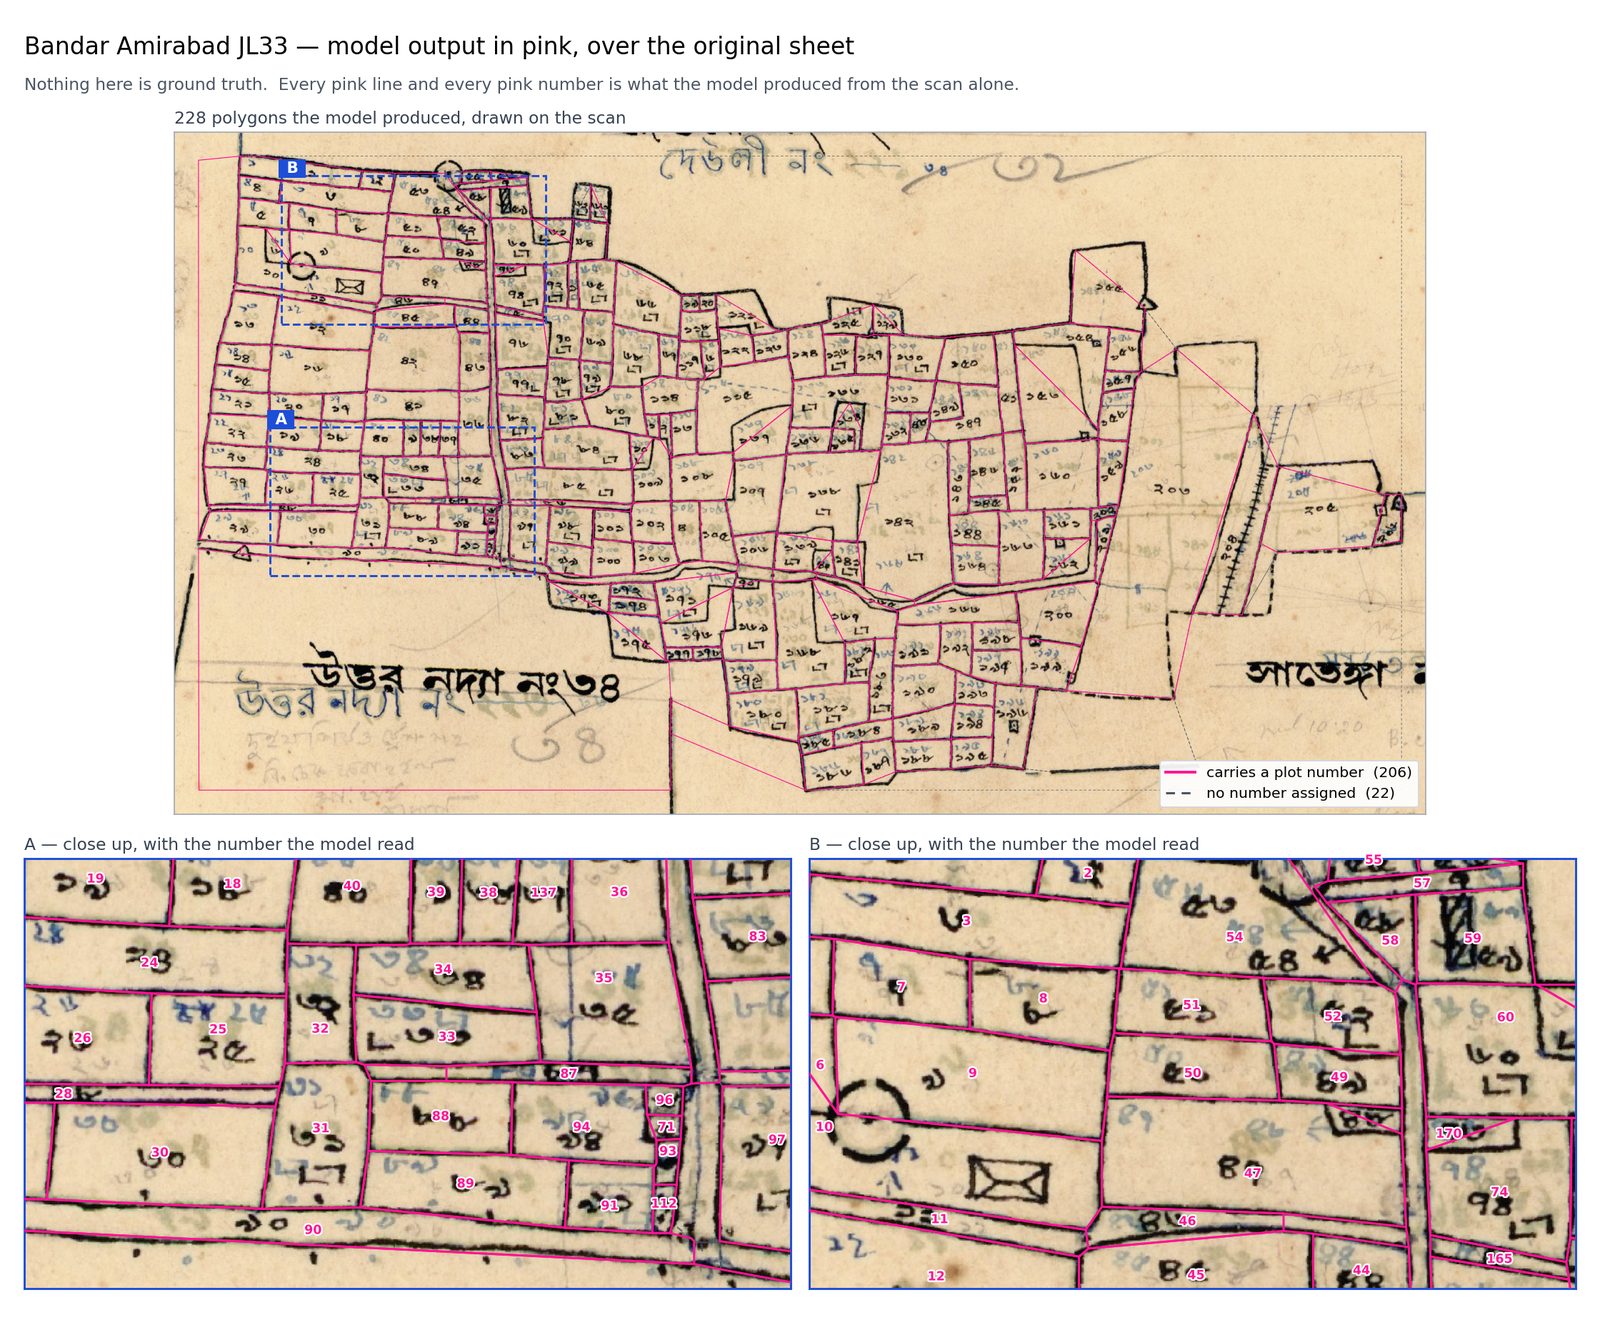
Our model takes a scanned mouza sheet and returns every plot on it as a digital outline, placed on the ground in its real position, with the plot number it read from inside the plot. You can see the result at the top of this post. The model drew every pink line and wrote every pink number from the scan alone, with no tracing by a person.
The scan does not have to be clean. The sheets we work with have stains, fold marks, faded ink, pencil notes and numbers that were corrected by hand decades ago. The model has to tell a plot boundary from a road edge, a building outline or a crease in the paper, and a plot number from an area note or a stray mark.
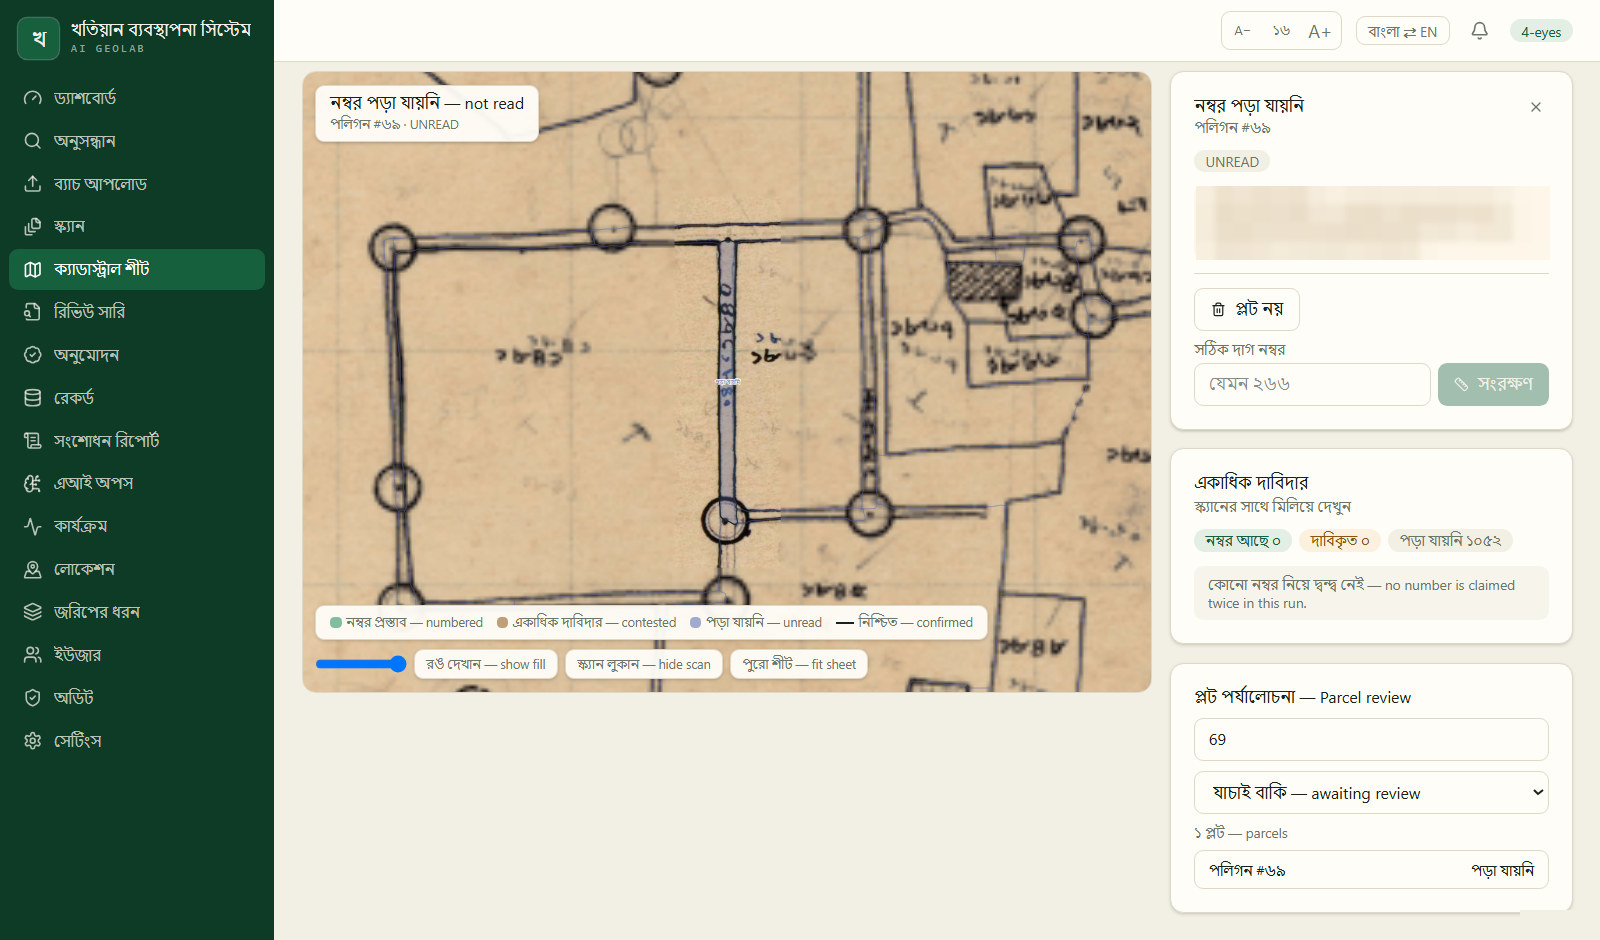
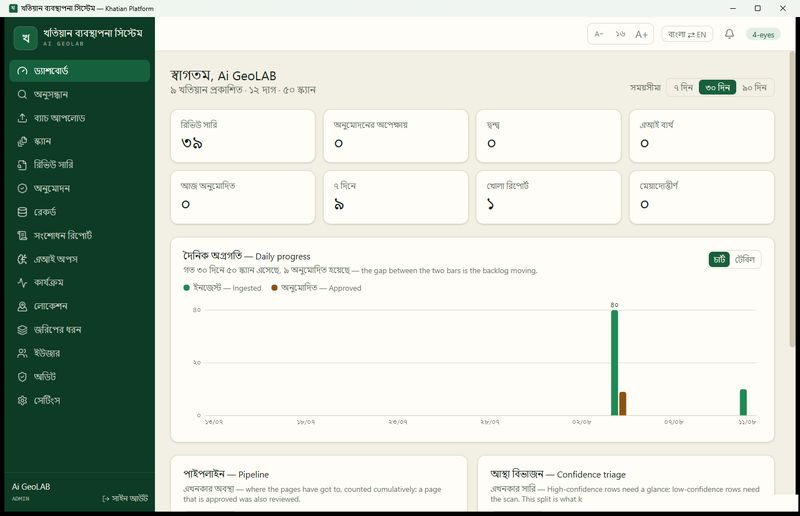
As with the khatians, nothing the model produces is final until a person has checked it. In the Khatian Platform, the reviewer sees each plot drawn over the original scan. Plots are coloured by what is known about them. Some have a number the model is confident about, some have a number that two plots both seem to claim, and some have no number yet. The reviewer can zoom in on any plot, see the scan at full detail and confirm or fix it. Once a plot has its number, a click on it shows the khatians that hold that plot, so the map and the record finally sit in one place.
How well it works
We tested the model on 22 mouza sheets it had never seen, with 7,216 plots between them. None of these sheets, and none of the draftsmen who drew them, appeared in anything the model saw during development.
- It found 95 percent of the plots.
- It found and read the correct number for 81 percent of all plots.
- A full sheet of about a thousand plots takes around a minute to outline on a single desktop computer.
Those are averages, and the honest picture is more uneven. On the best sheets, the model gets more than nine plots in ten right. On the worst, which are faded and heavily marked, it gets fewer than four in ten. Some plots on these sheets have no readable number at all, even for a person. This is why we always show the reviewer the scan next to the result, and why we never publish a plot without a check.
There was one problem we did not see coming. Our scores told us whether a plot had been found, but not whether its boundary sat exactly on the drawn line. While going through results in the viewer, we noticed that some boundaries sat slightly beside the ink. None of our numbers had shown it, because moving one edge of a plot by half a metre barely changes its area. That was humbling. We built a new way to measure where each boundary lies against the drawn line and fixed the problem. Across the 22 unseen sheets, the typical distance between our boundaries and boundaries traced by hand fell from 21 centimetres to 11 centimetres on the ground. For a plot about 30 metres across, that is a small fraction of a step.
What this means for Bangladesh
A digital map turns a plot number into a place. Once every plot on a sheet has an outline and a number, anyone with the right access can find a plot, measure it, see its neighbours and put it on top of other maps, such as roads, flood zones or the new digital survey.
It also makes the old survey usable next to the new one. When the new survey reaches a mouza, its plots can be compared with the plots drawn decades earlier. Where they agree, the records carry over with confidence. Where they disagree, a land office knows exactly which plots to look at.
Why this matters for land valuation
Value depends on where land is. Two plots in the same mouza can be worth very different amounts if one faces a main road and the other sits behind a row of houses. The reform the government proposed in June 2025 recognises this. Instead of one value for a whole mouza, a mouza could be split into clusters when prices inside it differ (The Business Standard). Drawing those clusters needs every plot on a map, and a ledger alone cannot provide that.
A digital mouza map gives each plot an area, a location and neighbours. A valuer can check the area on a deed against the area of the plot as drawn, find comparable sales next door rather than across the mouza, and see whether a plot touches a road or a river. When the government acquires land for a road or an economic zone, the plots on the route can be listed directly instead of being worked out sheet by sheet. We believe this is where fair valuation becomes practical, because it ties a price to a real piece of ground.
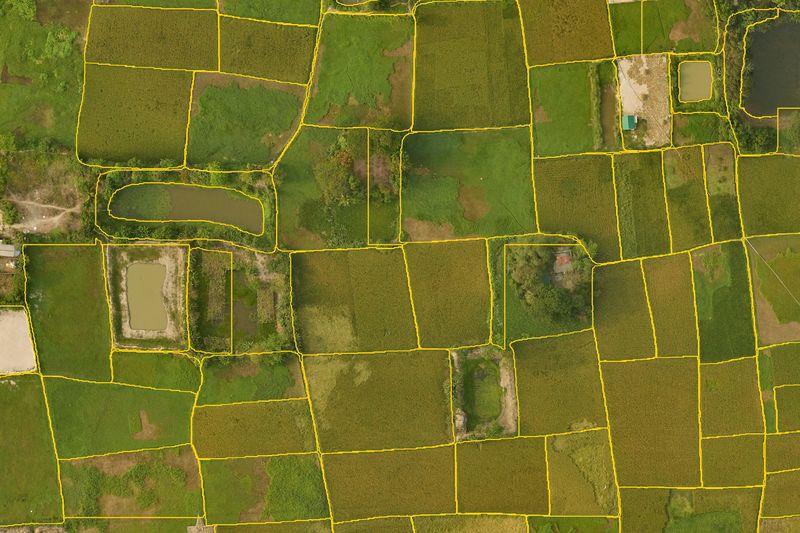
The map still shows the land as it was surveyed, though. A plot drawn as one paddy field decades ago may now hold three houses and a pond. In the next post, we look at what the land looks like today, and how we read that from the air.