Records describe the past
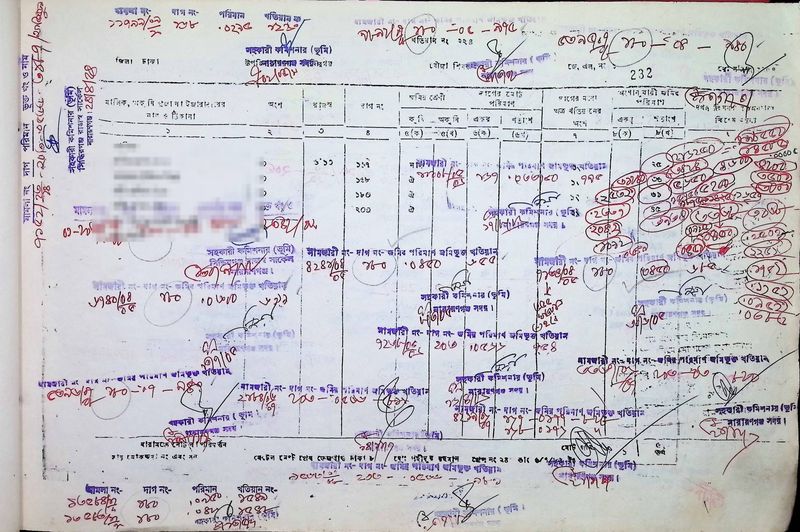
A land record and a cadastral map describe the land on the day it was surveyed. After that day, the land keeps changing. Families divide a plot among heirs. Owners sell part of a field. Someone digs a pond, raises the ground for a house or builds a factory. Some of these changes reach the record room as mutations. Many do not, or reach it years later.
This is true everywhere, but it matters most where land is small, crowded and valuable. A record can be perfectly preserved and still be out of date. To know what a plot is today, you have to look at it.
Looking at Bangladesh from the air
Until recently, looking at the land meant sending someone to walk it. In 2025, a national aerial campaign photographed the country at 10 centimetres per pixel. At that detail you can see individual houses, ponds, boats on the river and the bunds (আইল) between paddy fields.
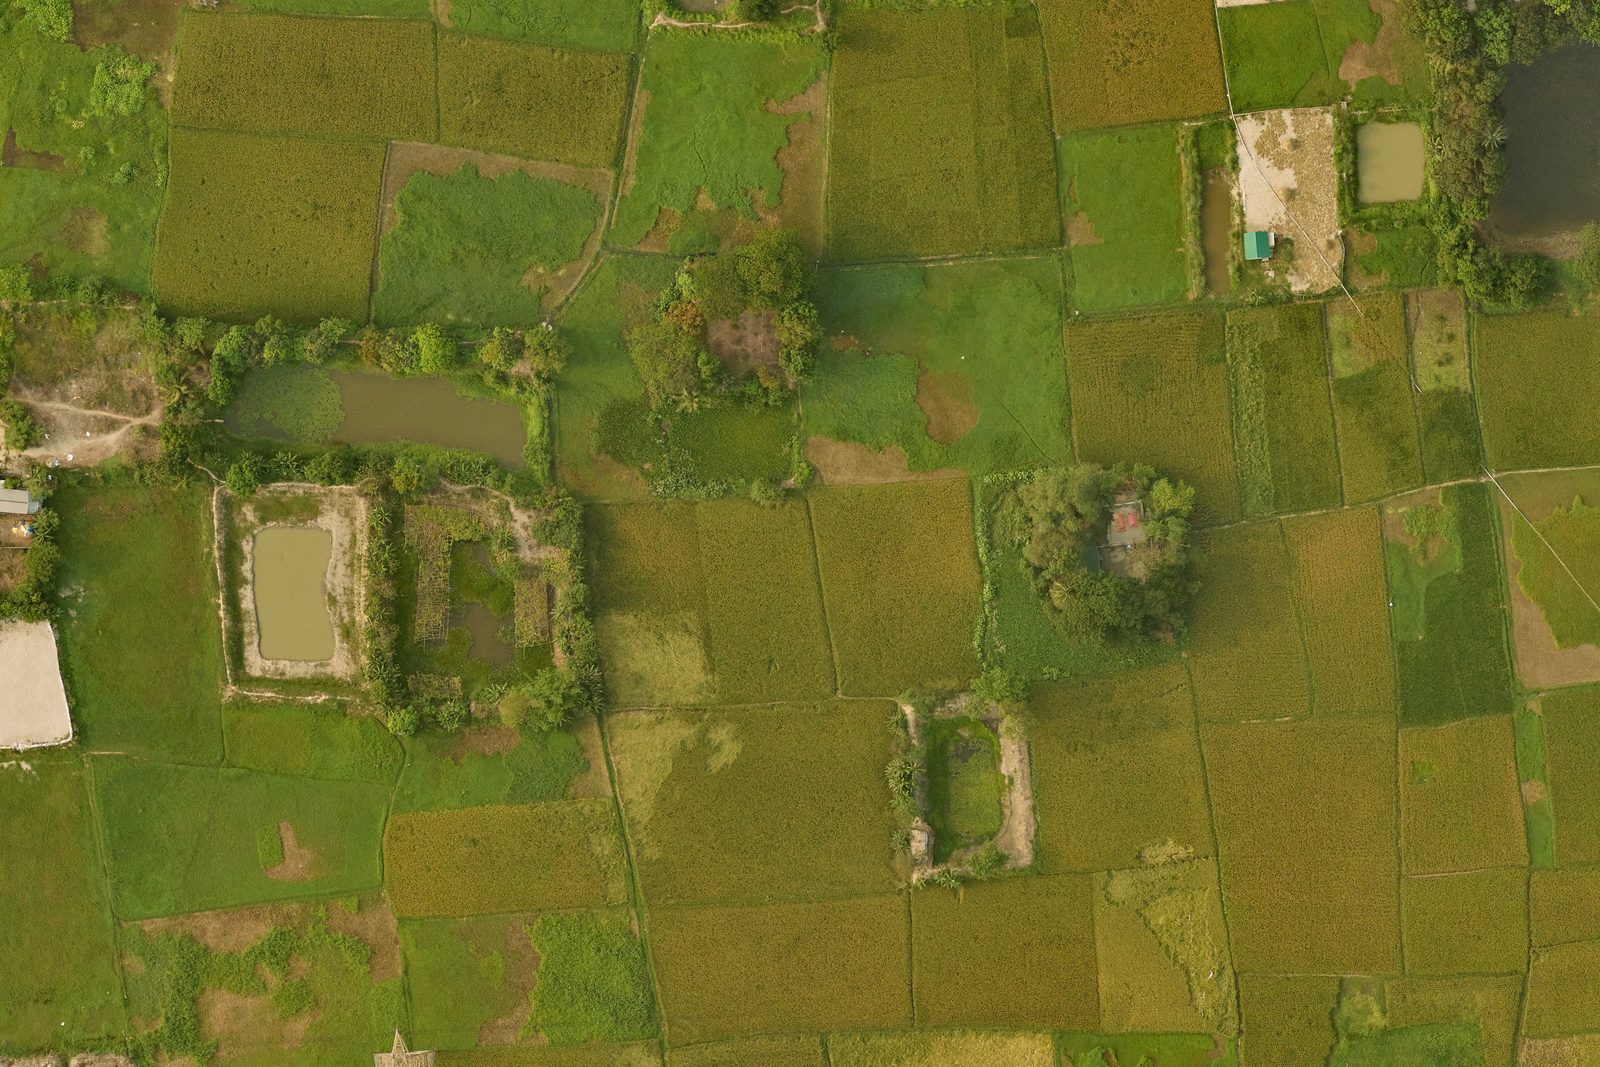
However, a photograph is not a map. Nobody can trace millions of field edges by hand, and the edges are harder to see than they look. A bund is often only 20 to 40 centimetres high. Two neighbouring fields can carry the same crop at the same stage, so the colour does not change across the edge. In one square kilometre of Narayanganj, more than half of the fields our model found were smaller than 300 square metres, about the footprint of a large house.
We tried a widely used general-purpose image model first. It followed changes in crop colour inside fields instead of the bunds, and cut fields in places where no edge existed. That told us the same thing we learned from the khatians. A model built for ordinary photos does not understand Bangladeshi farmland.
What our model does
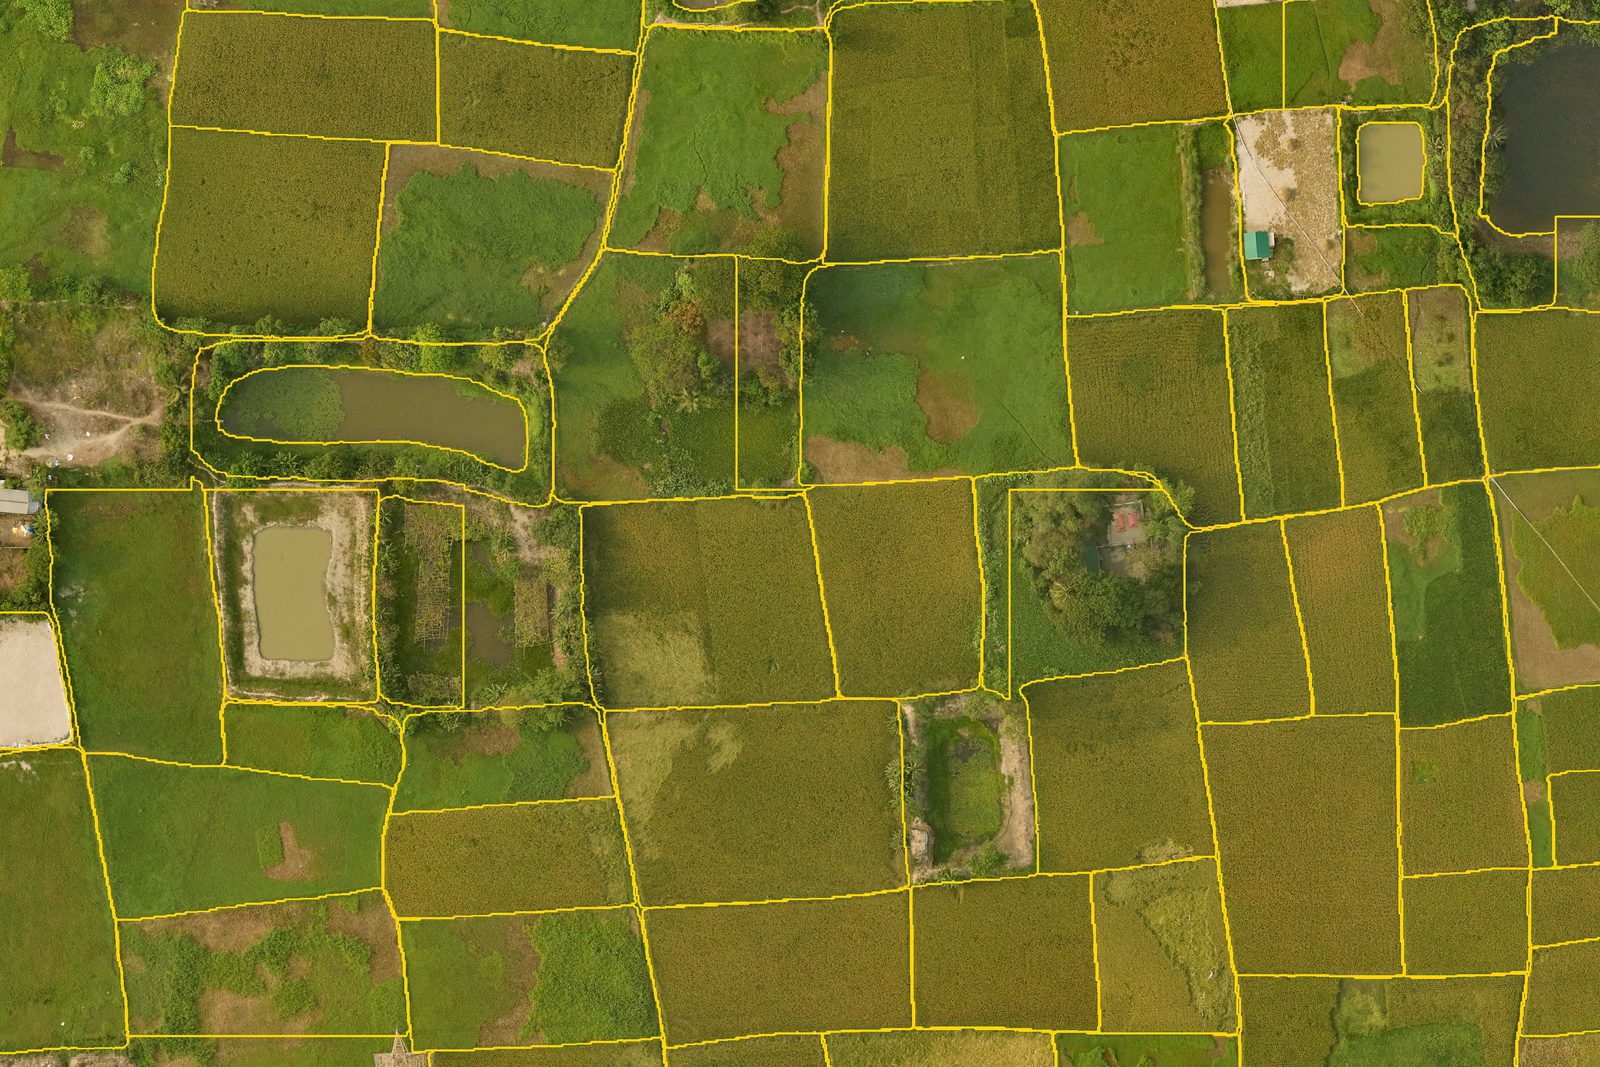
Our model takes the aerial photo and outlines every distinct piece of land it can see, mostly paddy fields, along with ponds, yards and homestead plots. It does not decide who owns anything. It shows what is on the ground.
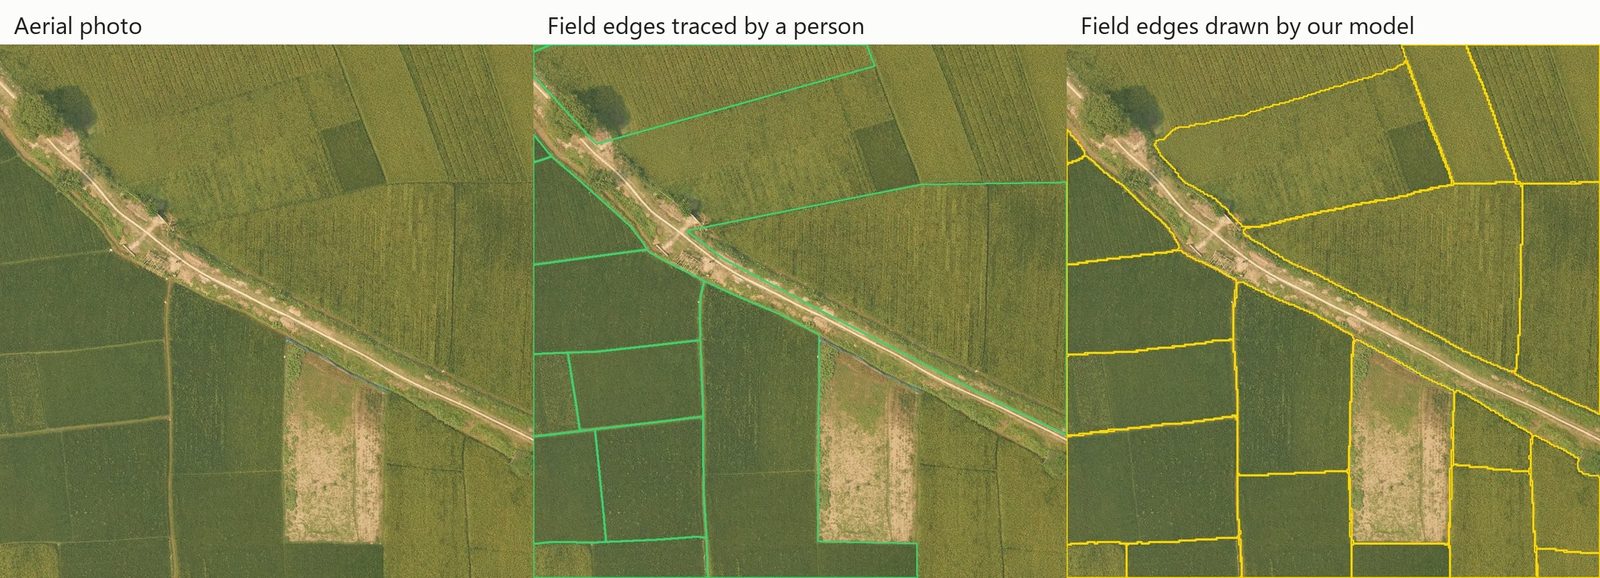
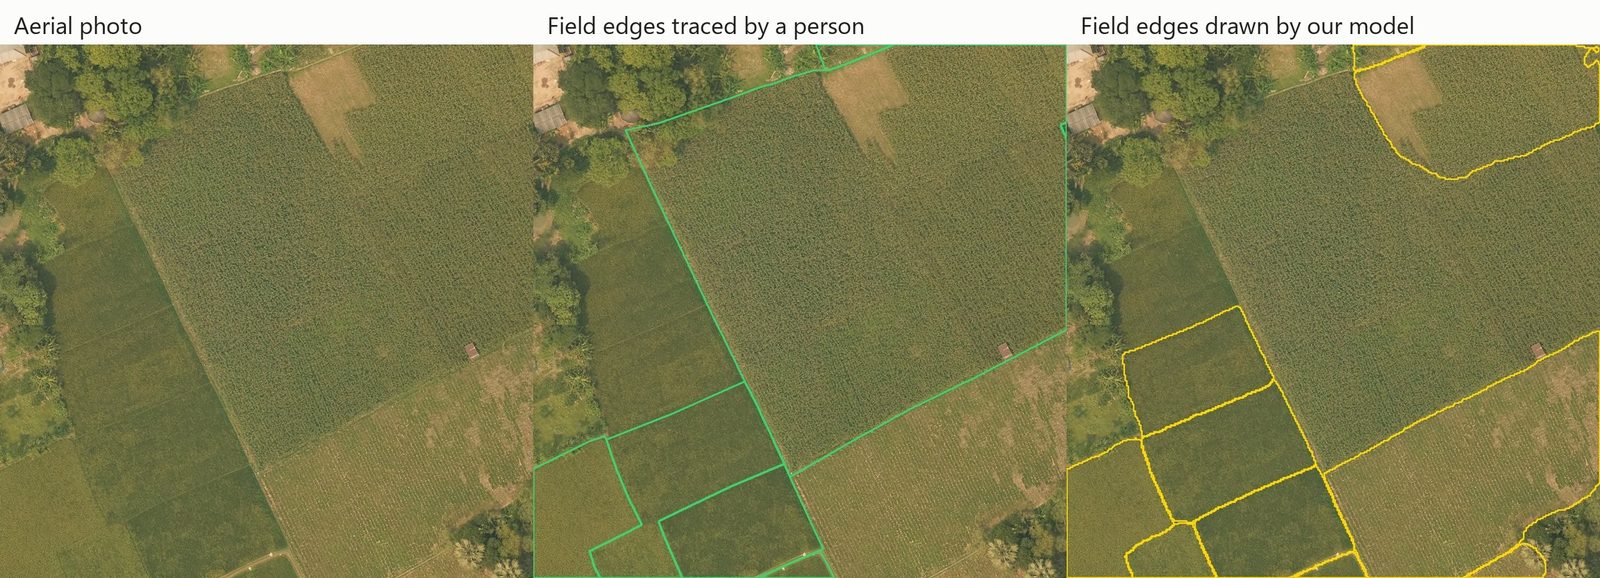
The comparisons above taught us something about our own labels. The people who traced the reference outlines often drew one outline around a holding that contains several separate fields. Our model, on the other hand, outlines the fields it can see. In one test area, a single traced plot of 1.15 hectares covered about 18 separate fields. By the old scoring, every one of those 18 fields counted against the model. Once we understood that, we started scoring the model on what it is meant to find, the fields that are physically there.
How well it works
On test areas the model had never seen, it found 79 percent of the single fields a person had traced, and 78 percent of the fields it drew matched a real field. We then ran it, unchanged, over Narayanganj, a district it had never seen at all. There, for about 78 percent of the rural plots on the mouza maps, it shows at least one field on that ground. It takes about a minute and a half per square kilometre on one desktop computer.
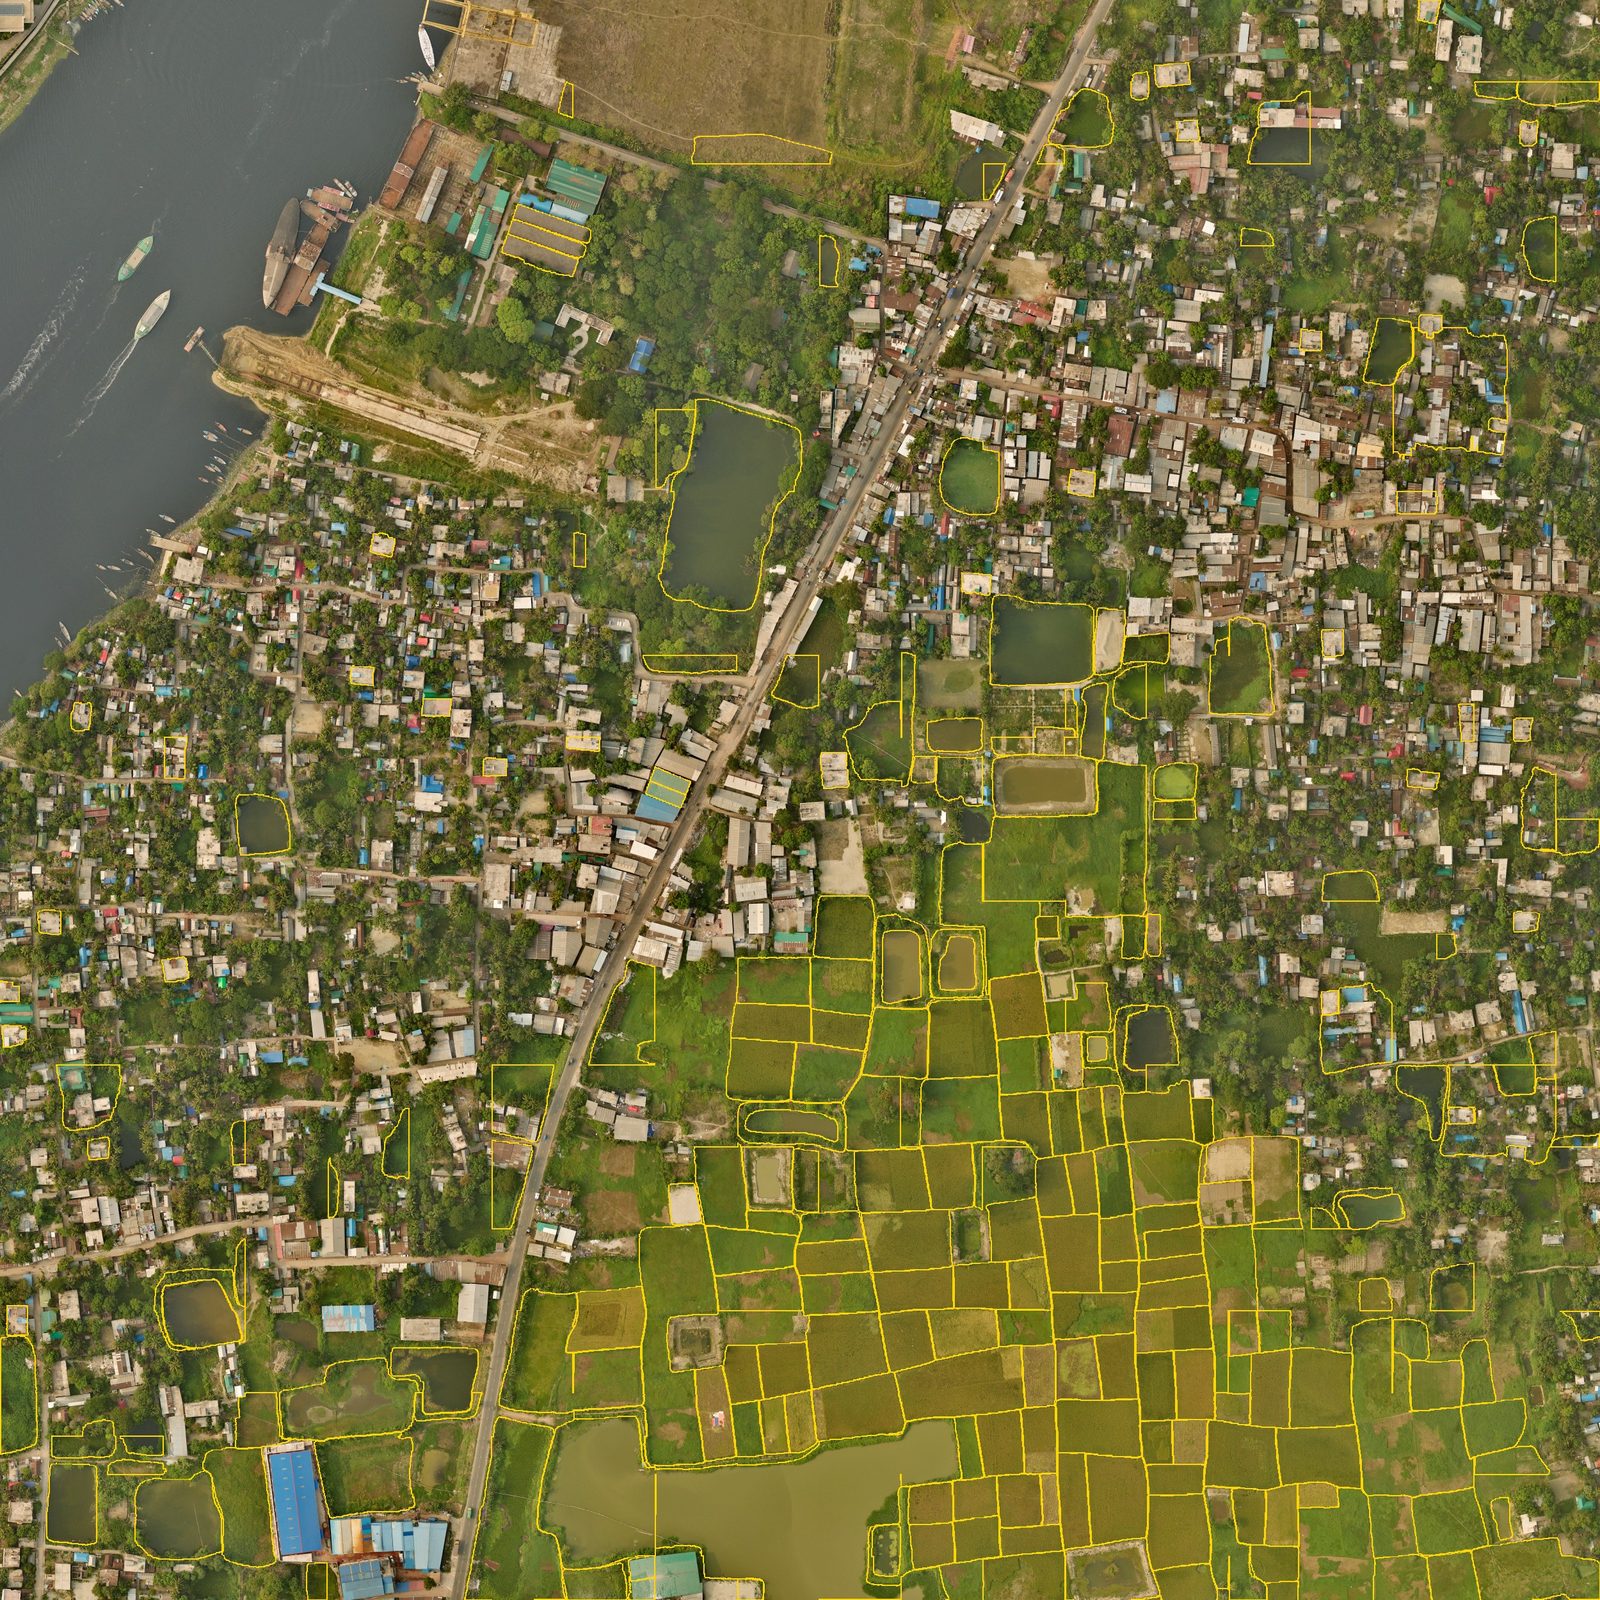
The image above also shows the model’s biggest weakness. It works well on farmland and poorly in towns. We found this while testing, when the scores jumped around between samples for no clear reason. When we broke them down by area, the cause was obvious. Almost all of our labelled examples came from rural land, so the model had learned rural land. We did three things about it. We shipped a rural-only version so the platform could keep running, we told the people using it exactly where it should and should not be trusted, and we started collecting more labels, including from towns. That work is going on now.
Then and now
This is where the work comes together. The mouza maps from part 2 were drawn decades ago. The aerial photos were taken in 2025. When we place the two on top of each other, rural sheets drawn in the 1960s land within about a metre of where the photo says they should, judged by eye.
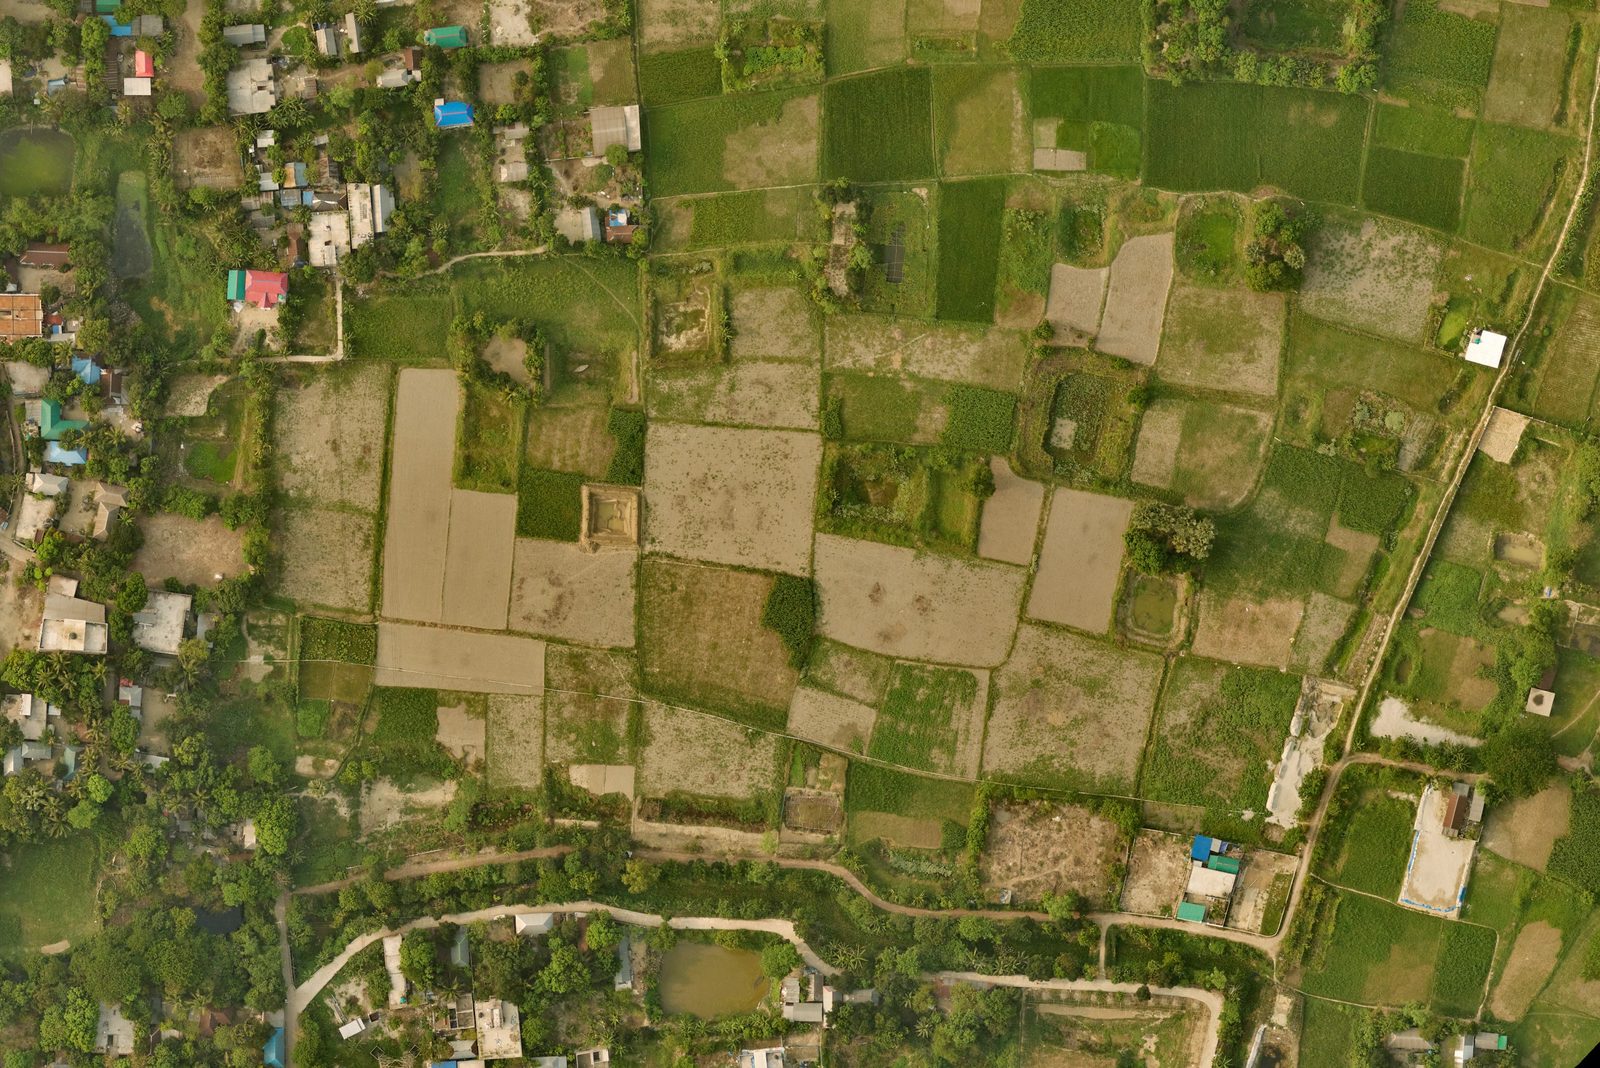
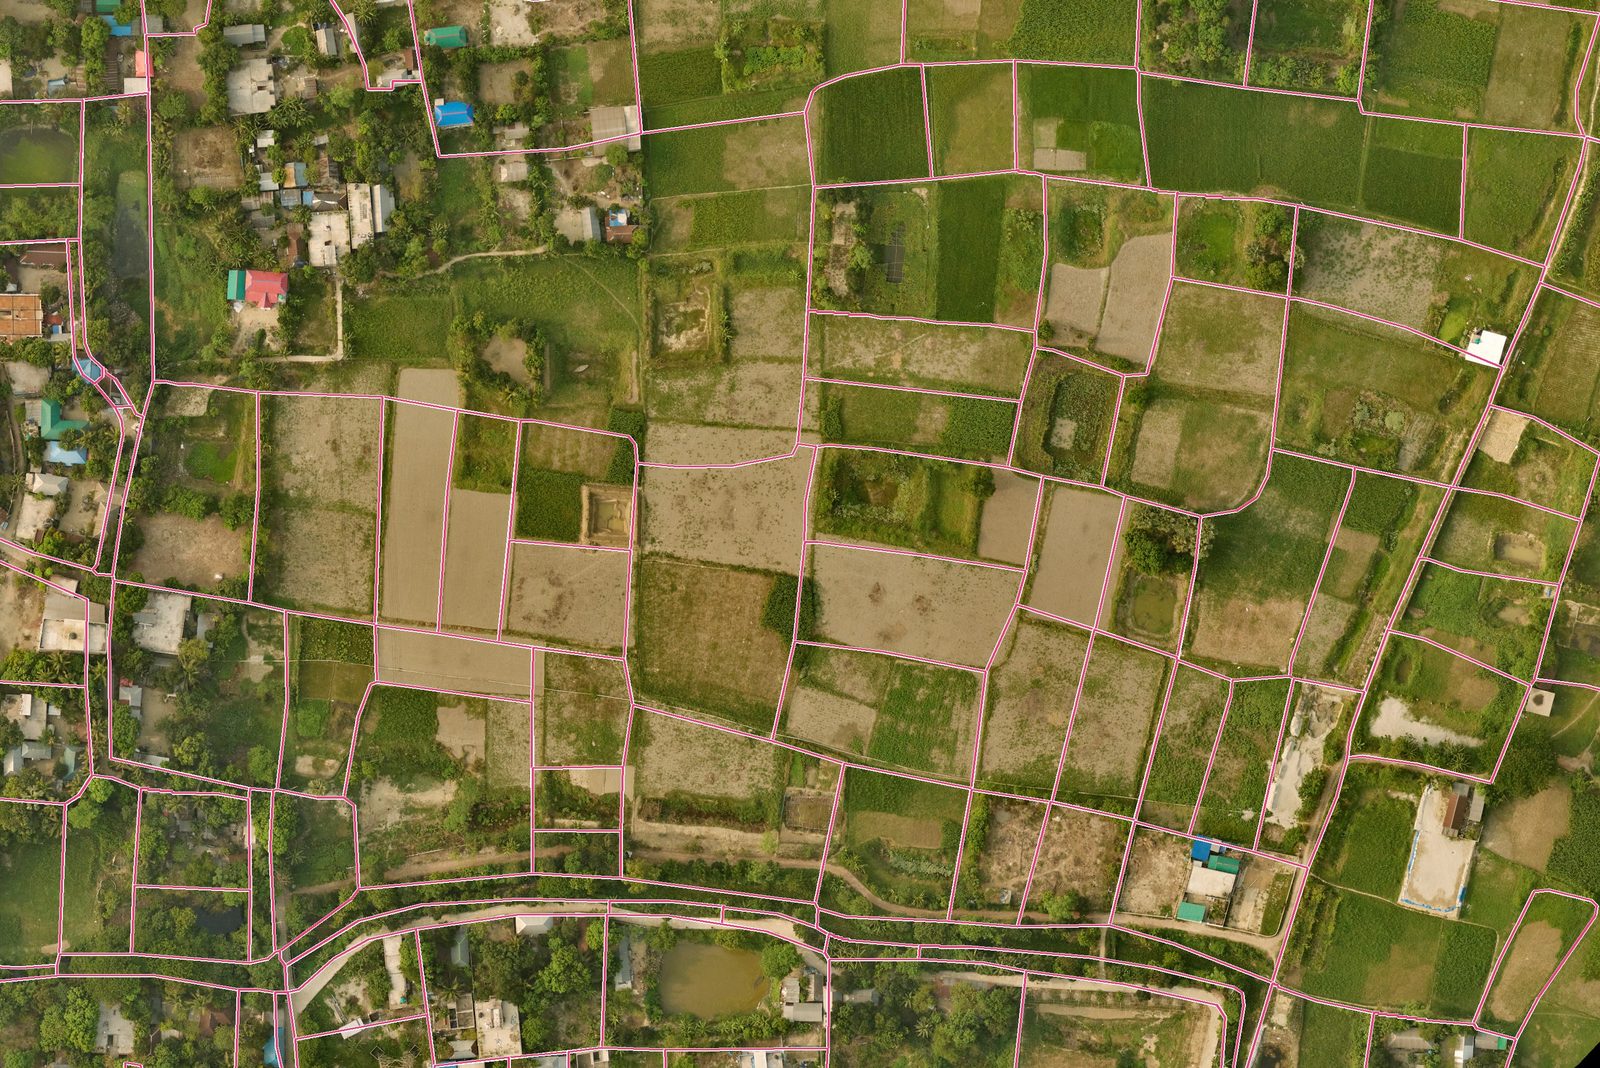
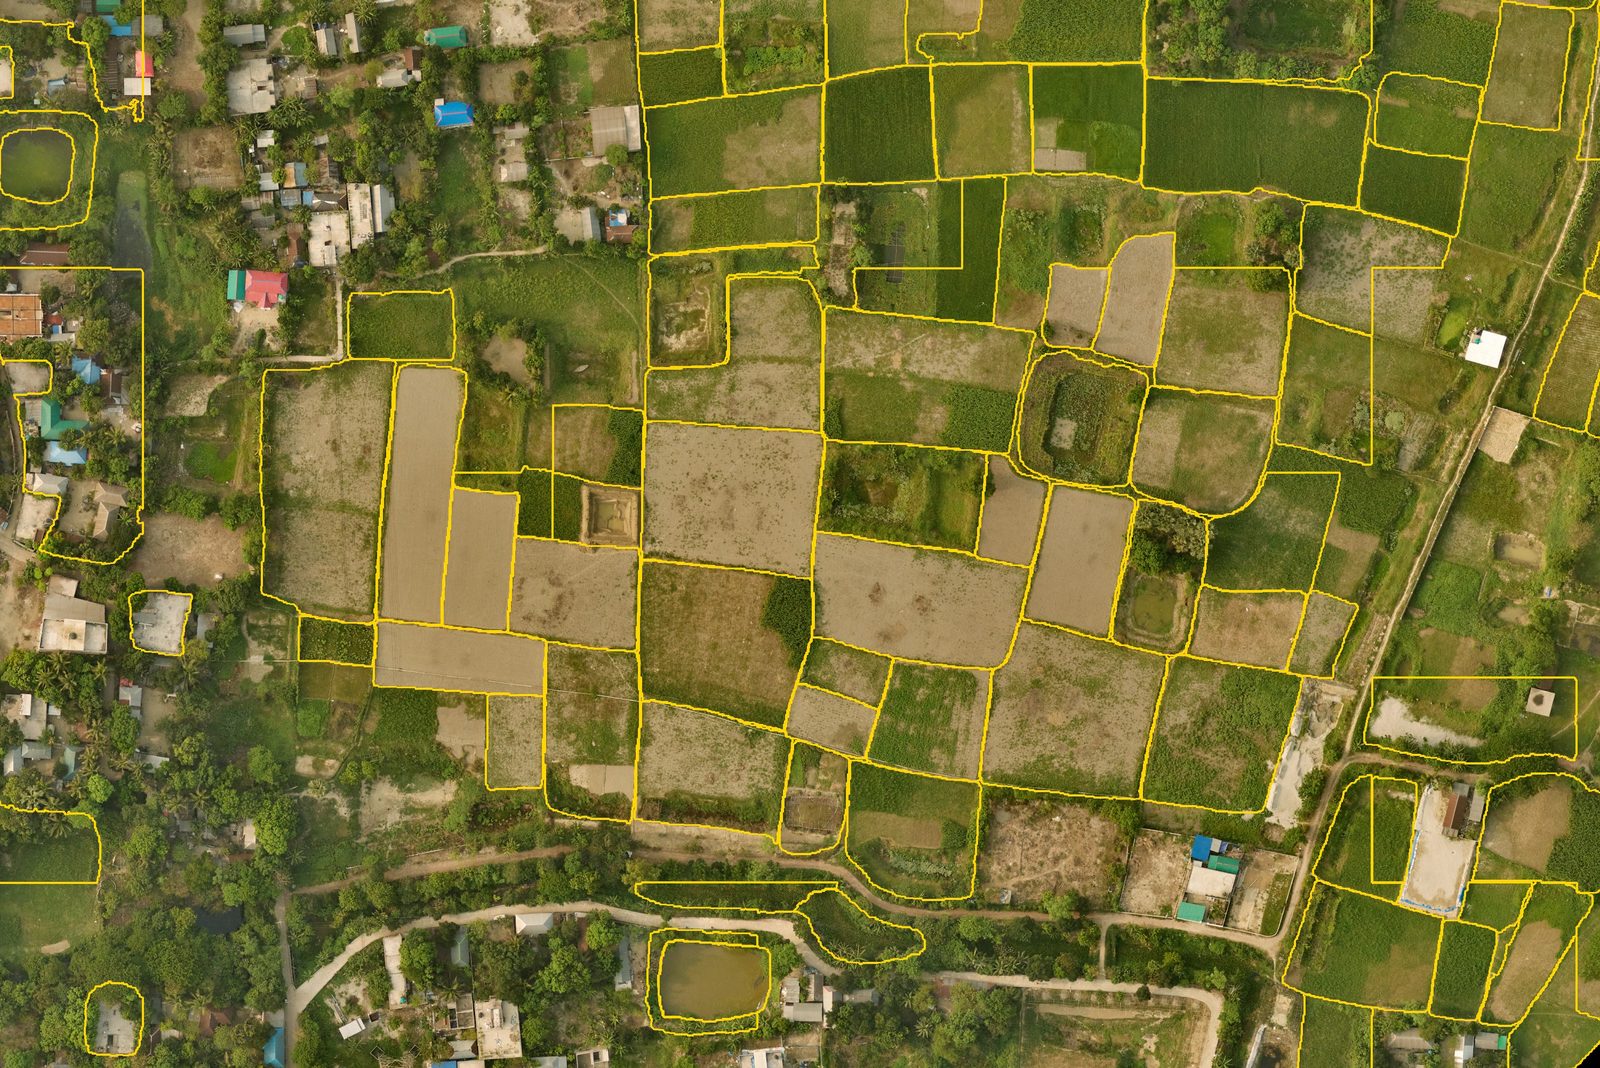
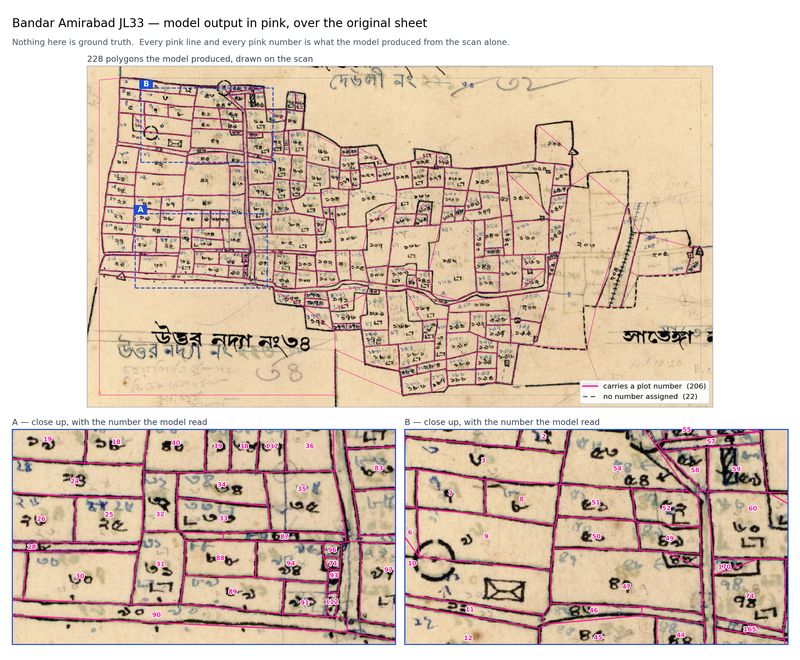
Look at the pink map and the yellow fields side by side. In many places the old plot lines still run along today’s bunds, decades later. In other places a single plot on the map now holds several fields, a pond, or a cluster of houses. A disagreement between the two is not an error. It is information. It tells a land office where the land has changed since the survey, and where the record is most likely to be out of date.
What this means for Bangladesh
For the first time, it is practical to check a record against the land itself across a whole district. A land office can see which plots have been divided, which have been built on and which have become ponds, without sending someone to every plot. Planners can see where towns are spreading into farmland. When the new digital survey reaches an area, surveyors can start from a picture of what is on the ground today.
Why this matters for land valuation
What a plot is used for today is one of the biggest drivers of its value. A decimal of homestead land does not sell for the same price as a decimal of low-lying paddy, and a plot next to a new road changes in value long before its record changes. Official values in Bangladesh are set by mouza and by land class (The Business Standard). If the class on record says paddy and the photo shows a house, the value set from the record is wrong.
With the record, the map and the photo in one place, a valuer can see the class on record and the use on the ground side by side. A bank can see whether the land behind a loan is what the papers say it is. A land office can see where recorded classes are out of date across a whole mouza, and update them before the next round of valuations. We believe this is how valuation can follow the land as it is, instead of the land as it was.
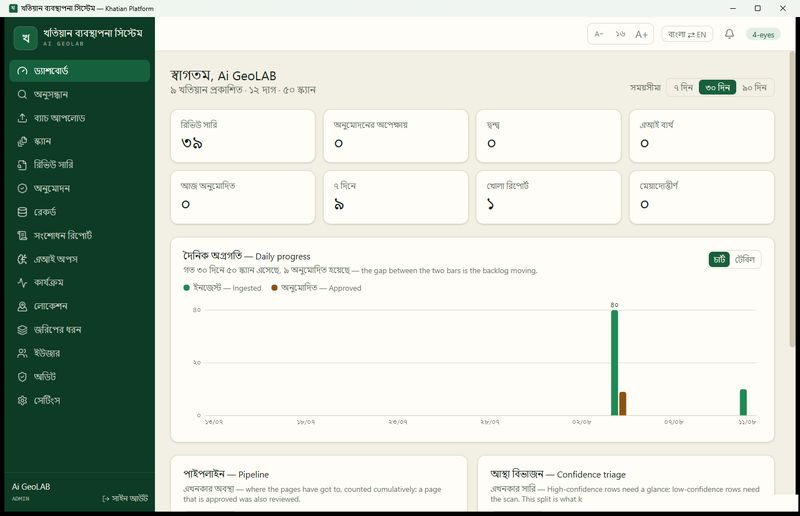
In the final post of this series, we show the software that brings all three together, the Khatian Platform.