A score is only as useful as the test behind it. Ninety-one out of a hundred, but on which pages? Pages the model had already seen, or pages from places it had never seen? Anyone deciding whether to rely on AI for land records should be able to ask that and get a plain answer.
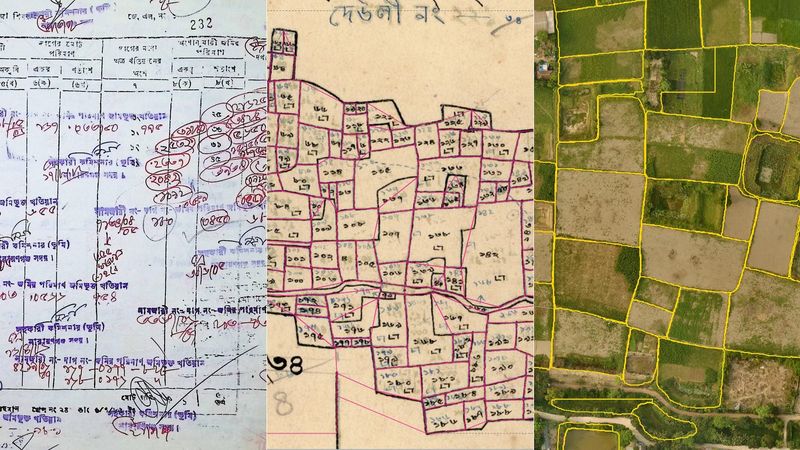
This post is our answer, written for land offices, banks and valuers as much as for development partners and engineers. It covers how we test the three models behind the Khatian Platform, what we measure, where results fall below the averages and how general-purpose AI compared. The numbers come from our posts on handwritten khatians (খতিয়ান, the record of rights to land), mouza maps (মৌজা, the smallest revenue unit) and the land as it looks today.
Testing on what the models have never seen
Every score here was measured on material our models had not seen while they were being built. We held back whole mouzas, whole map sheets and whole areas of ground, not pages picked here and there. Pages from one place share habits, such as a clerk’s handwriting or a draftsman’s numerals, and a model can learn them. Tested on familiar pages, it would look better than it will on records from somewhere it has never seen.
- Khatians: 200 khatians per test, from two collections, only from mouzas the model never saw during development.
- Mouza maps: 22 sheets with 7,216 plots between them. None of the sheets, and none of the draftsmen who drew them, appeared in development.
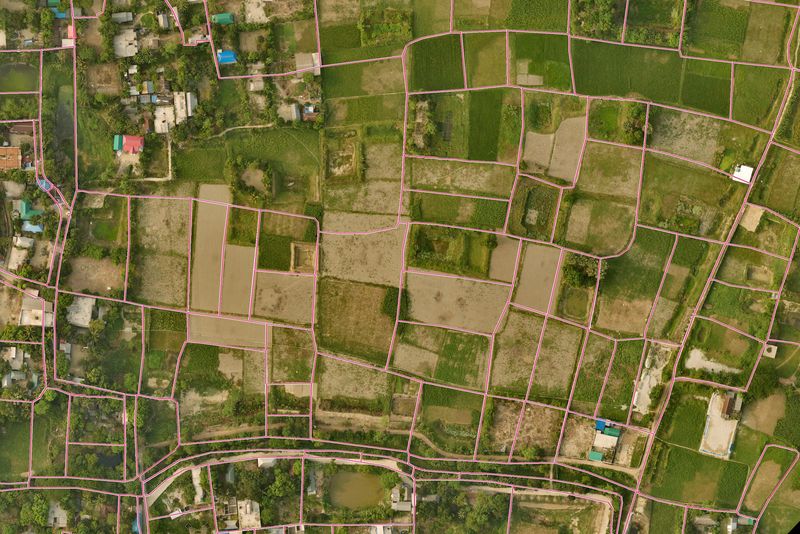
- Aerial photos: test areas the model had never seen, then Narayanganj, a district it had never seen at all, with the model run unchanged.
What we measure for each model
One number cannot describe a model, so each gets more than one.
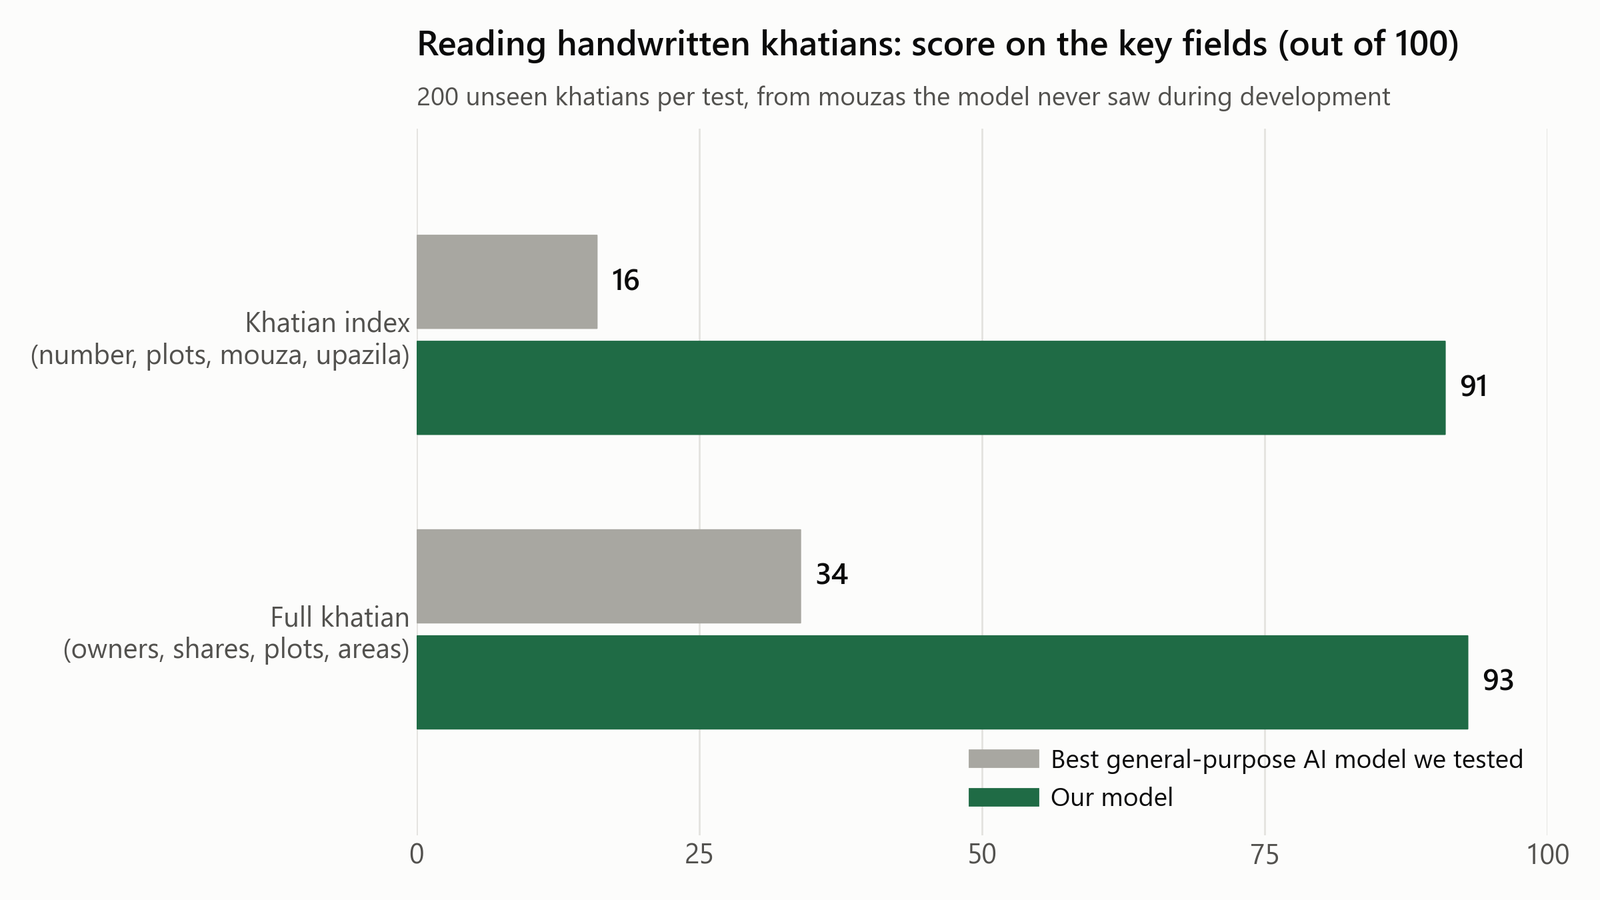
Khatians. We score the index fields separately from the full record. The index fields are what you need to find a record: the khatian number, the plot (dag) numbers, the mouza and the upazila (sub-district). The full record is what you need to use it: owners, shares, plots and areas. On the unseen khatians, our model scored 91 out of 100 on the index fields and 93 out of 100 on the full record.
Mouza maps. Finding a plot and reading its number are different questions. On the 22 unseen sheets, the model found 95 percent of the plots, and found and read the correct number for 81 percent of all plots. In the Khatian Platform, clicking a numbered plot shows the khatians that hold it, so a wrong number points to the wrong records.
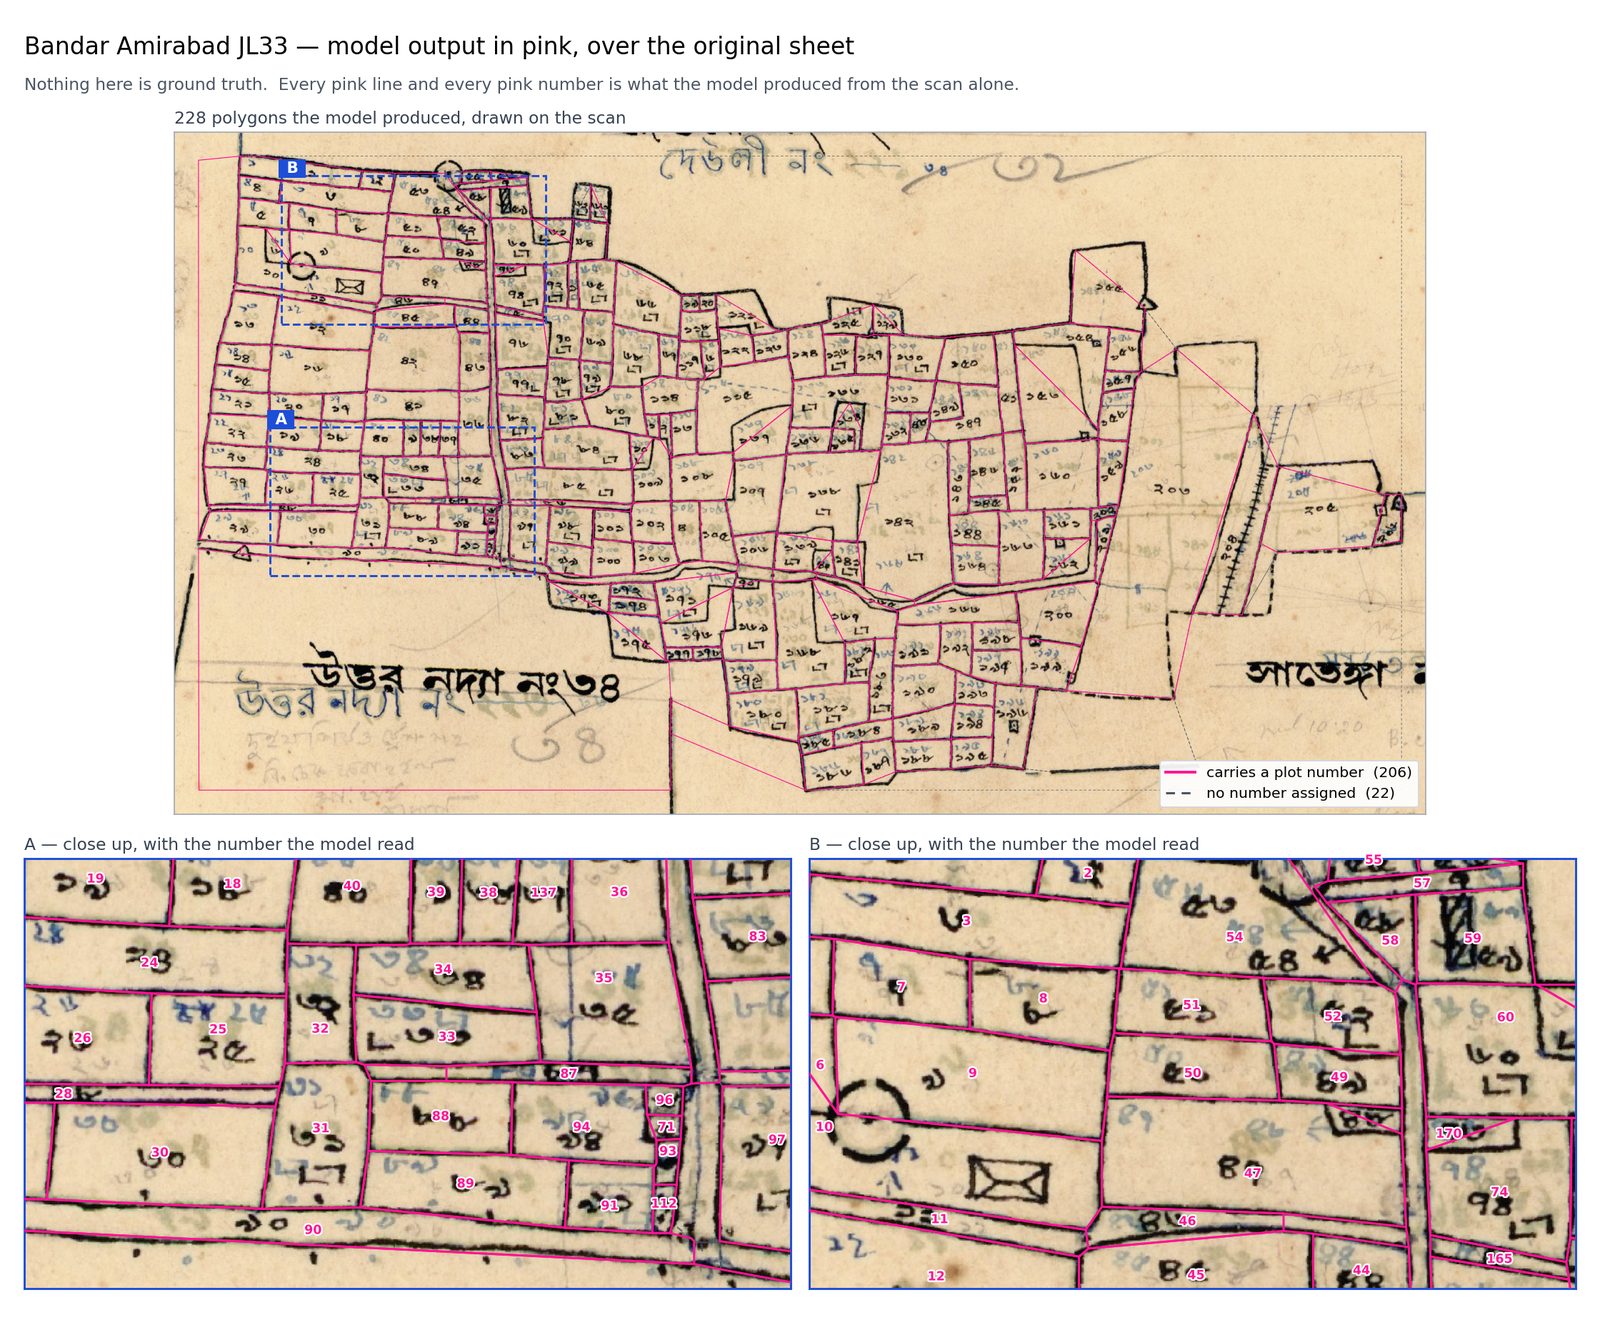
The map model also taught us that a score only catches the errors it was designed to look for. Our first scores told us whether a plot had been found, not whether its boundary sat exactly on the drawn line. When some of the model’s boundaries sat slightly beside the ink, none of those scores showed it, because moving one edge of a plot a little barely changes its area. We built a way to measure where each boundary lies against the drawn line, and fixed the problem. Across the 22 unseen sheets, the typical distance between the model’s boundaries and boundaries traced by hand fell from 21 centimetres to 11 centimetres on the ground.
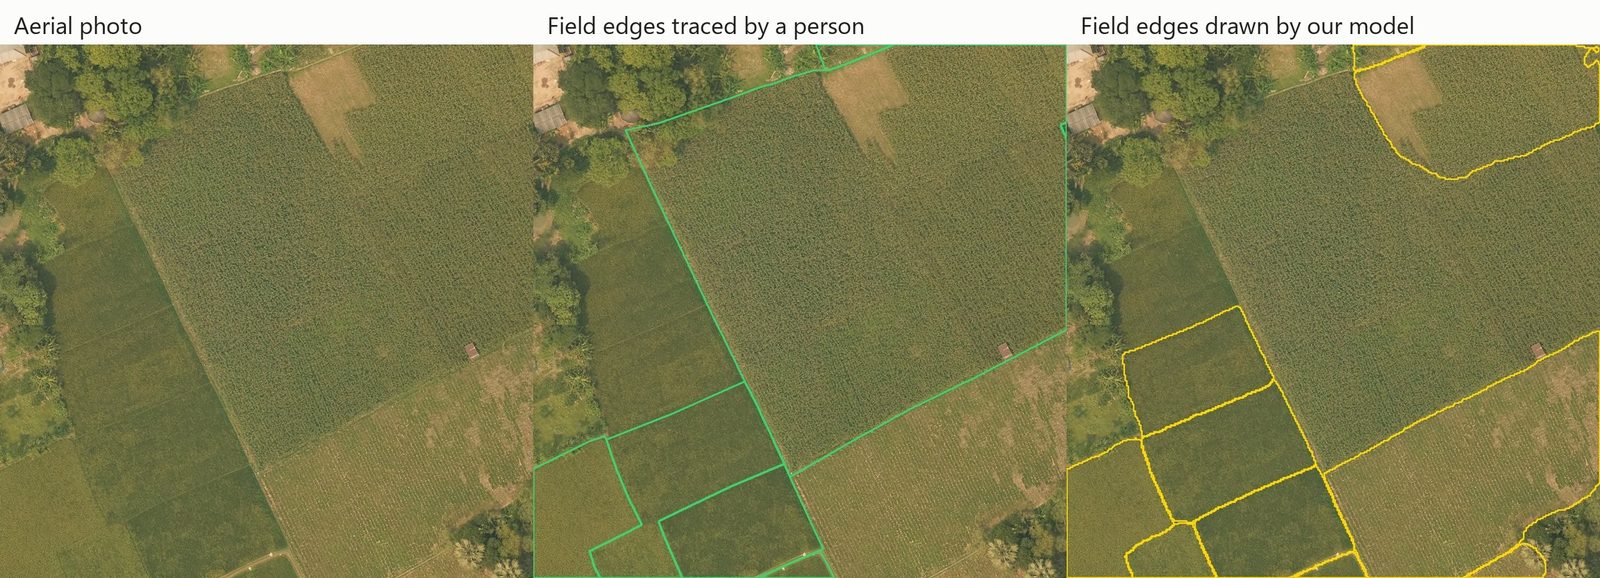
Fields from the air. We also had to change how the imagery model is scored. The people tracing our reference outlines often drew one outline around a holding of several fields: one traced plot of 1.15 hectares covered about 18 separate fields. Scored against outlines like that, the model lost marks for drawing fields that are really there. We now score it on the fields physically present.
A team that changes its scoring after seeing results deserves a hard look, so here is our reason. The imagery model does not decide who owns anything. It shows what is on the ground. Which fields make up a holding is a question for the khatian and the mouza map, not the photo.
On test areas it had never seen, the imagery model found 79 percent of the single fields a person had traced, and 78 percent of the fields it drew matched a real field. The first figure shows how much it misses. The second shows how much of what it draws is real. A model that drew only the few fields it was surest of would score well on the second and badly on the first, which is why we report both.
Reporting the uneven picture
An average is a summary, not a promise. On the map model’s best sheets, it gets more than nine plots in ten right. On the worst, which are faded and heavily marked, it gets fewer than four in ten, and some plots have no readable number even for a person. An office with sheets like that is likely to see results below the average, and we would rather say so before it starts.
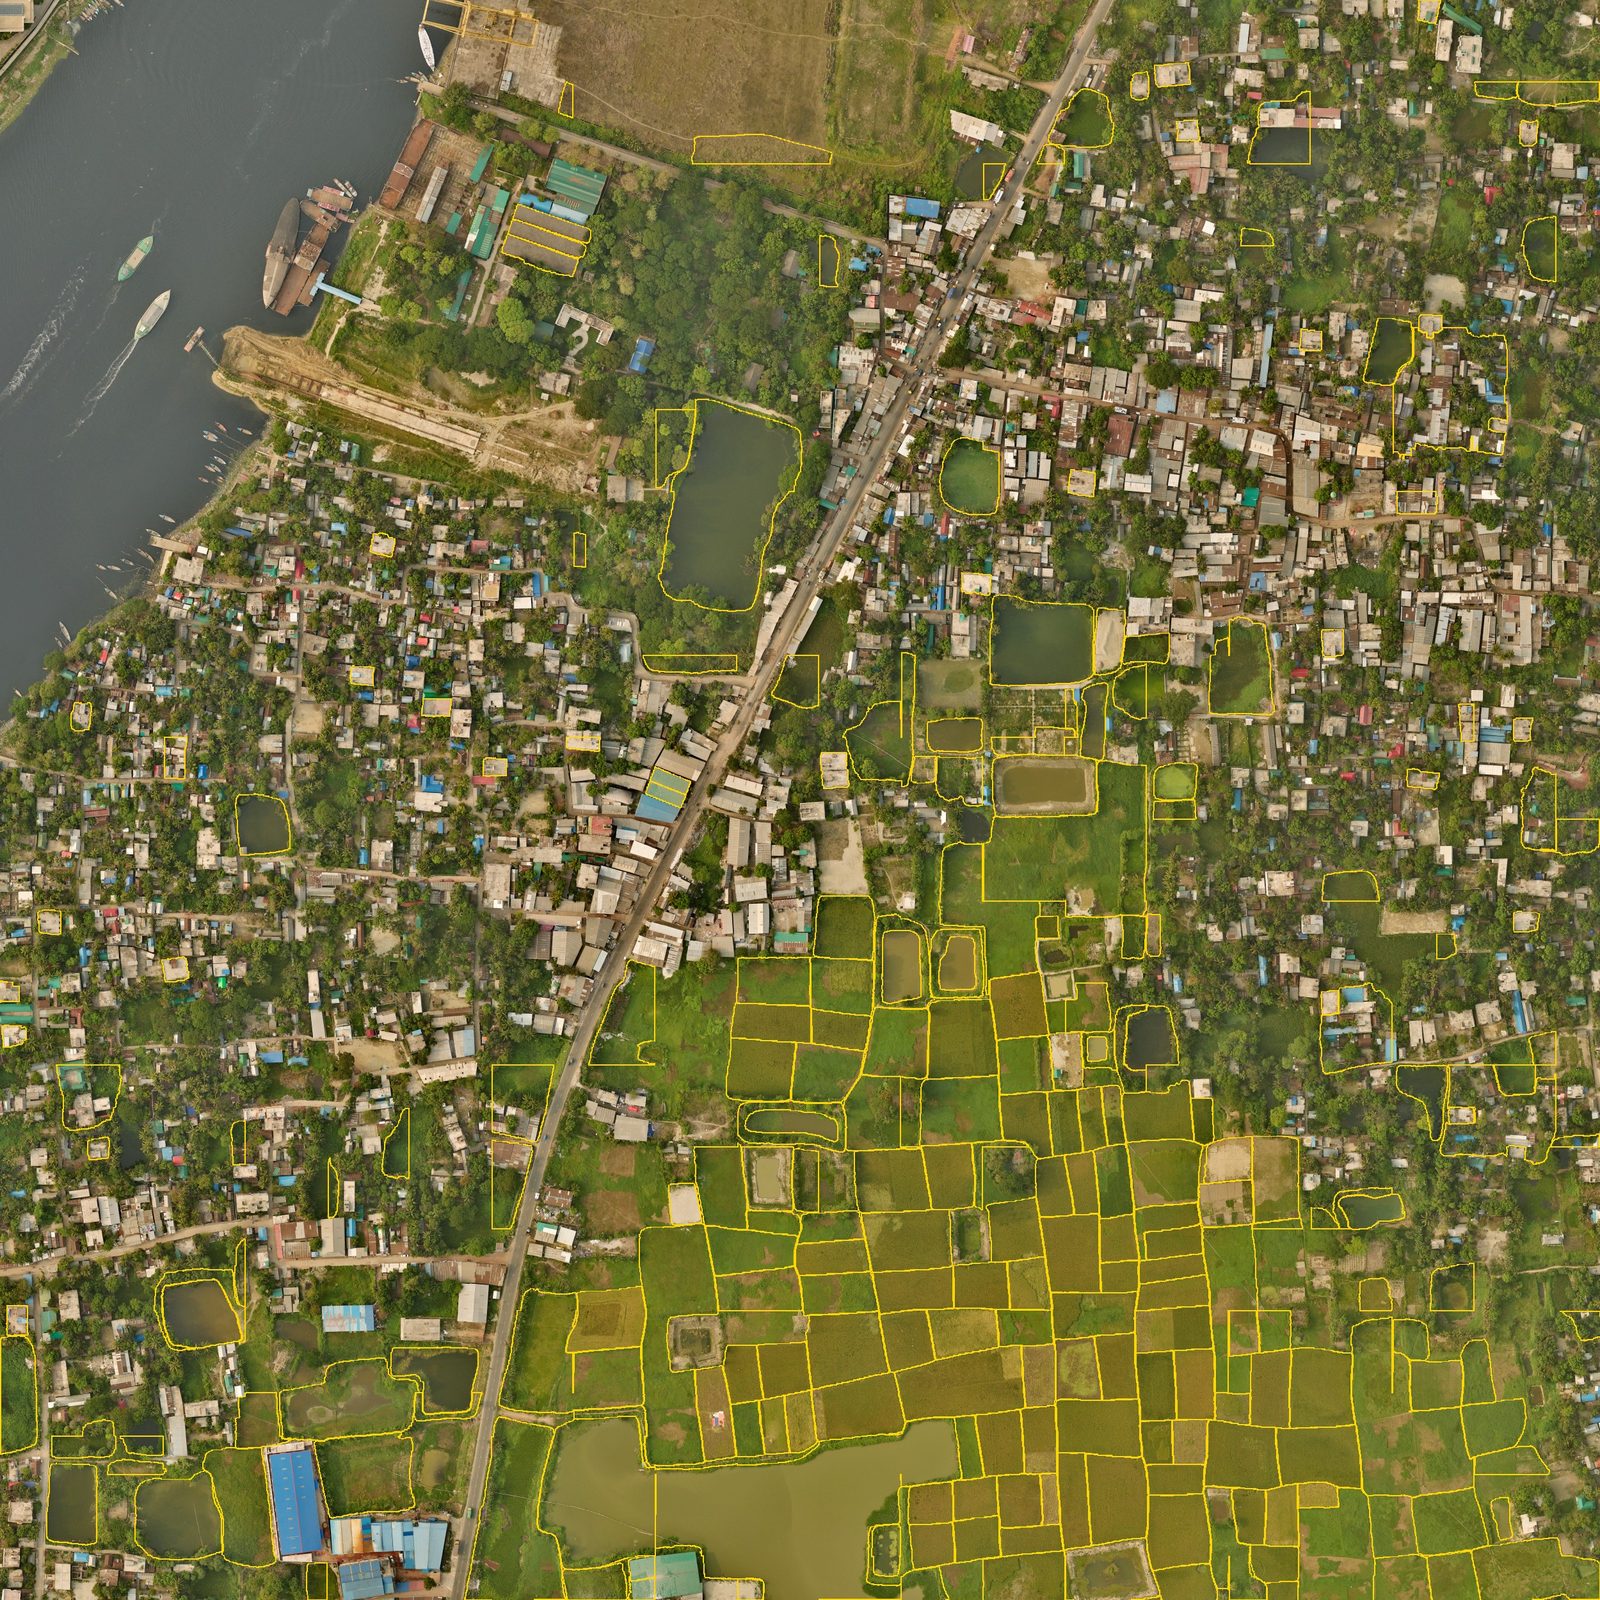
The clearest case is the image at the top of this post. The imagery model works well on farmland and poorly in towns, because the examples it learned from were mostly rural. So we shipped a rural-only version and told the people using it where to trust it and where not to.
Even the district-wide figure carries its condition. Across Narayanganj, for about 78 percent of the rural plots on the mouza maps, the model shows at least one field on that ground. That tells you how often a reviewer will see something from the photo for a rural plot, not whether every line is right, and nothing about towns.
Here is one of the less flattering comparisons, from farmland.
Why general-purpose AI falls short here
A specialist model has to earn its place against the obvious alternative, general-purpose AI. We tried it on khatians and aerial photos.
On khatians, the best general-purpose model we tested, run on the same pages as ours, scored 16 out of 100 on the index fields and 34 out of 100 on the full record. It got the district right about half the time, the khatian number about one time in eight and the mouza name fewer than one time in twenty-five. Some pages it could not read at all.
On aerial photos, a widely used general-purpose image model followed changes in crop colour instead of the bunds (আইল), the raised edges between paddy fields, and cut fields where no edge existed.
Neither result is a criticism of those models. Nobody built them for handwritten Bengali land records or Bangladeshi farmland, and the hard parts of this data are local. Many khatians carry decades of handwritten notes of later transfers (mutation, or namjari) over the printed table. A bund is often just a low, narrow strip of earth and grass, and neighbouring fields can carry the same crop at the same stage. In one square kilometre of Narayanganj, more than half the fields our model found were smaller than 300 square metres. A model built for ordinary photos has no reason to rank a low bank of earth above a change of colour. We believe that is why specialist models did better here, and we would not stretch the claim beyond this kind of data.
Why people still approve every record
Scores of 91 and 93 are not 100. Some pages are too damaged for anyone, and some handwriting is ambiguous even to an experienced clerk. A test score describes a model across many pages. Review deals with the page in front of you.
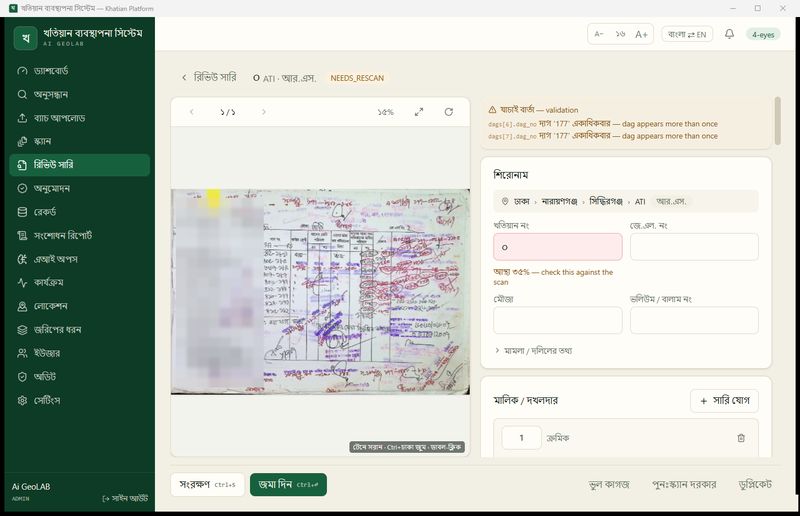
So every khatian the model reads goes to a reviewer. Fields it is unsure about are highlighted with a note to check them against the scan, and a plot number repeated within one record is flagged before anyone can approve the page. A page it cannot read at all still lands in the queue for manual entry. By default a reviewer cannot publish their own work: a second person approves it, and the platform enforces that rule. On mouza maps, a reviewer confirms or fixes each boundary and number against the scan. The AI never publishes anything on its own.
The records also remember which model read them. Each AI reading is tied to the version of the model that produced it. When we improve a model, an office can tell which records an older version read. There is more in our posts on the Khatian Platform and AI that stays in the land office.
Why this matters for land valuation
Valuation rests on what these tests measure. A valuer comparing plots in a mouza needs the right plot numbers and areas. A bank checking the record behind a mortgage needs the right owners and shares. A land office checking whether the class on record still matches the land needs a current picture of it. A misread area puts a plot in the wrong comparison, which is why test conditions and human review matter. See how records, maps and photos come together for valuation.
What we are working on
The clearest gap is the imagery model in towns, so the new labels we are collecting include towns. We believe the version that comes out of that work should be tested the same way, on ground it has never seen, with its results in towns and on farmland reported separately. Until then, we ship the rural-only version.
Questions about how we test? Get in touch.
More on each model